DatadogのApache Integrationを有効化する方法
概要
はじめに
- 今回は、DatadogのApache Integrationを有効化する方法をご紹介します。
- Datadogは、SaaSで提供されるシステムモニタリングツールであり、現在担当する案件でも、サーバーやアプリケーションの監視に使用しています。Datadog の概要は、下記のログミーTechで公開されている服部さんの記事を参照ください。

Apache Integrationが有効化されていない…
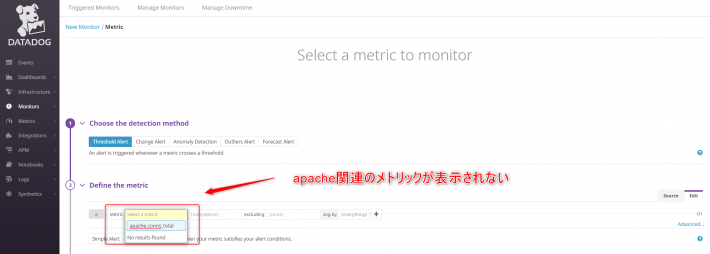
- Datadogでは、Apache Integrationを有効にすることで、下記のメトリクスが使用可能です。しかし、DatadogにApache Integrationをインストールしたつもりが、apache関連のメトリクスが一つも取得できないことが分かりました。
- apache.conns_async_closing(connections)→ The number of asynchronous closing connections.
- apache.conns_async_keep_alive(connections)→ The number of asynchronous keep alive connections.
- apache.conns_async_writing(connections)→ The number of asynchronous writes connections.
- apache.conns_total(connections)→ The total number of connections performed.
- apache.net.bytes(bytes)→ The total number of bytes served.
- apache.net.bytes_per_s(bytes/second)→ The number of bytes served per second.
- apache.net.hits(requests)→ The total number of requests performed.
- apache.net.request_per_s(requests/second)→ The number of requests performed per second.
- apache.performance.busy_workers(threads)→ The number of workers serving requests.
- apache.performance.cpu_load(percent)→ The percent of CPU used.
- apache.performance.idle_workers(threads)→ The number of idle workers.
- apache.performance.uptime(seconds)→ The amount of time the server has been running.
- 以下の通り、メトリクスの選択時にapache関連のメトリクスが表示されていません。
DatadogにApache Integrationを導入するまでの手順
- 以下に、DatadogにIntegrationを導入して、メトリクスが取得できるまでの手順をまとめます。
- 監視対象のサーバーに、Datadog Agent がインストールされていることが前提です。
DatadogにIntegrationをインストールする
- Integrations → Integrations にて、Availableの一覧から「Apache」を選択して、「Install」を押します。
- Integrationをインストールしただけでは、「No data received」となり、まだ監視対象のサーバーから情報を取得できていません。
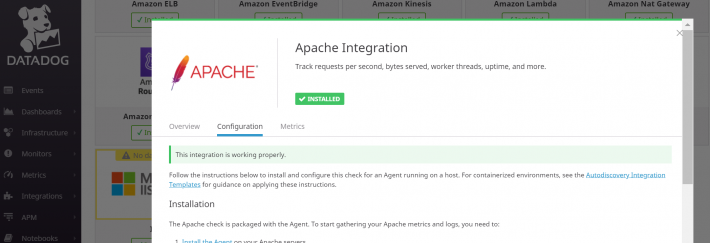
- Apache IntegrationのConfiguration には、下記の手順が記載されています。
Installation
The Apache check is packaged with the Agent. To start gathering your Apache metrics and logs, you need to:
- Install the Agent on your Apache servers.
- Install
mod_statuson your Apache servers and enableExtendedStatus.Configuration
- Edit the
apache.d/conf.yamlfile in theconf.d/folder at the root of your Agent’s configuration directory to start collecting your Apache metrics and logs. See the sample apache.d/conf.yaml for all available configuration options.- Restart the Agent.
Apache 2.4のmod_status moduleを使用可能にする
- 先ず、監視対象のサーバーに、mod_status moduleがloadされていることを確認します。こちらの環境では、デフォルトでloadされていましたが、コメントアウトされている場合はアンコメントします。また、ディストリビューションやパッケージのバージョン等によって、confファイルが異なる場合がありますので、ご注意ください。
$ pwd
/etc/httpd/conf.modules.d
$ grep mod_status *conf
00-base.conf:LoadModule status_module modules/mod_status.so
- 次に、httpd.confに「ExtendedStatus On」および「server-status」の設定を追加します。「server-status」はリクエストがあった場合に、ハンドラを実行して結果を返します。なお、「server-status」の設定は、Apacheのドキュメントにも記載がありますが、Apache 2.4はアクセス許可(Order Deny,Allow)の記述がApache 2.2 から変更になっていますので、下記の記述とします。
ExtendedStatus On
<Location /server-status>
  SetHandler server-status
  Require all denied
  Require ip 127.0.0.1
</Location>
- httpd.confの編集後、confの記述に誤りがないかを確認します。問題がなければ、httpdサービスを再起動します。
$ apachectl configtest
Syntax OK
$ sudo systemctl restart httpd.service
$ systemctl status httpd.service
- 監視対象サーバーから、下記の方法で、server-statusが確認できることを確認しましょう。
$ curl http://localhost:80/server-status?auto
Total Accesses: 11940
Total kBytes: 195033
CPULoad: .0101632
Uptime: 88555
ReqPerSec: .134831
BytesPerSec: 2255.25
BytesPerReq: 16726.4
BusyWorkers: 1
IdleWorkers: 8191
Scoreboard: ____________________________________________________________________
** 省略 **
Apache 2.4+VirtualHost環境でmod_status moduleを使用可能にする
- 監視対象のサーバーのhttpd.confにVirtualHostを構成している場合、前述の設定だけでは既存のVirtualHostを参照するため「server-status」の設定が有効となりません。VirtualHost環境は、「server-status」の 確認用として、新しくVirtualHost設定を追加します。
- 必須のServerName、DocumentRootと調査のためにErrorLog、CustomLogを記載します。
ExtendedStatus On
<VirtualHost *:80>
  ServerName Localhost
  DocumentRoot /var/www/html
  ErrorLog /var/log/httpd/localhost.error.log
  CustomLog /var/log/httpd/localhost.access.log combined
  <Location /server-status>
    SetHandler server-status
    Require all denied
    Require ip 127.0.0.1
  </Location>
</VirtualHost>
- httpd.confの編集後、confの記述に誤りがないかを確認します。問題がなければ、httpdサービスを再起動します。
$ apachectl configtest
Syntax OK
$ sudo systemctl restart httpd.service
$ systemctl status httpd.service
- 監視対象サーバーから、下記の方法で、server-statusが確認できることを確認しましょう。
$ curl http://localhost:80/server-status?auto
Total Accesses: 11940
Total kBytes: 195033
CPULoad: .0101632
Uptime: 88555
ReqPerSec: .134831
BytesPerSec: 2255.25
BytesPerReq: 16726.4
BusyWorkers: 1
IdleWorkers: 8191
Scoreboard: ____________________________________________________________________
** 省略 **
Datadog Agentのapache.d/conf.yamlを設定する
- 最後に、Datadog Agent の設定を追加します。apache.d配下に、conf.yaml.exampleがありますので、conf.yamlにリネームします。
- Datadog Agentのサービスを再起動して、設定を読み込みます。
$ cd /etc/datadog-agent/conf.d/apache.d
$ ls -l
合計 16
-rw-r--r-- 1 dd-agent dd-agent  209  9月 26 12:26 auto_conf.yaml
-rw-r--r-- 1 dd-agent dd-agent 9036  9月 26 12:26 conf.yaml.example
$ sudo cp -p conf.yaml.example conf.yaml
$ sudo systemctl restart datadog-agent.service
DatadogでApache Integrationを使ってみる!
- Datadog のApache Integrationのステータスが「No data received」から「This integration is working properly.」に変わりました。
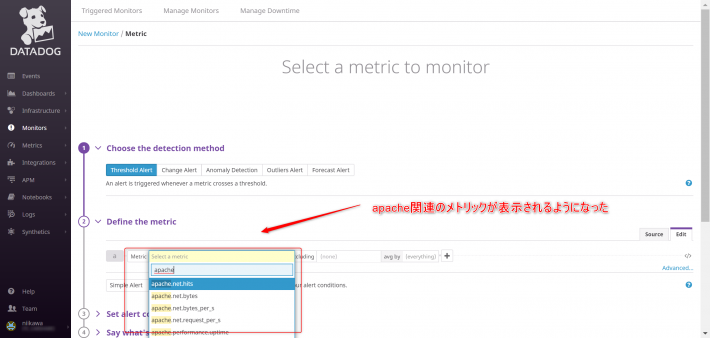
- 無事にメトリクスの選択時にapache関連のメトリクスが表示されるように変わりました。
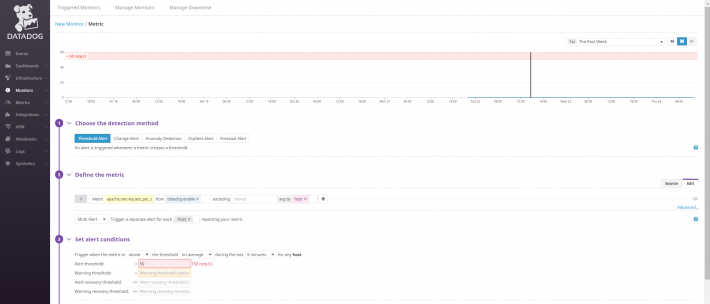
- このメトリクスを使い、Apacheを監視するための新しいmonitor が作成できます。